Maintenance
The Maintenance option will keep track of regular operations performed by the system and allows you to perform edits to Maintenance items contained in the touch screen.
|
NOTE: Use of an Ethernet connection is required in order to use the Maintenance features of TS Manager. Maintenance features will not function using a USB connection with Active Sync or Mobile Device Center. |
Maintenance Items
|
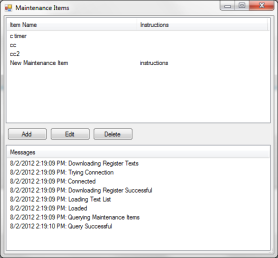
Figure 16 - Maintenance Items window |
The Maintenance Items option allows the user to set up and edit maintenance events. The Add button will add a new maintenance item.
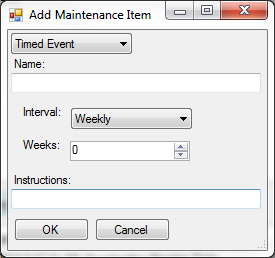
The type of event can be changed by using the drop-down menu at the top of this window. This will display the options of Timed Event, Conditional Timer Bit, Conditional Timer Data, Conditional Counter, and Total. Select the appropriate choice to add a new event. Cancel will return to the previous window without adding a new event.
Note that each Maintenance Item window contains an Instructions field. The text in this field will appear when the user selects Complete for a Maintenance Item shown in the Maintenance > Status menu on the product touch screen. Note that this action must be completed from the touch screen (not from TS Manager).
Timed Event: Selects the interval by using the dropdown menu. The choices are Hourly, Daily, Weekly, Monthly, and Yearly. Once the interval is selected, the user then decides how often this interval will be checked.
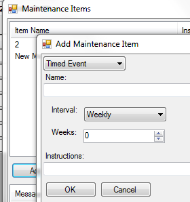
Figure 17 - Timed Event menu
Conditional Timer Bit: When setting up a conditional timer, the user assigns several parameters. First the user must assign the Register and the Bit. The Target determines the aggregated amount of time the bit has been on or off until maintenance is needed. The field ‘Bit is:’ determines whether the counter adds when the bit is turned on or adds when the bit is turned off without change.
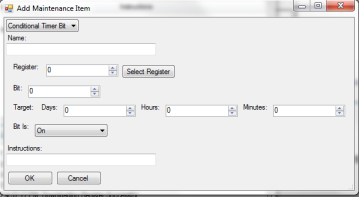
Figure 18 - Conditional Timer Bit menu
Conditional Timer Data: When setting up a conditional timer based on a data value, the user assigns several parameters. One parameter is the Target, which determines the aggregated amount of time the current value must remain in a certain state when compared to a reference value (defined in the To field) before maintenance is needed. When used, the Expression field defines a mathematical operation performed on the Register value before that value is compared to the value defined in the To field—for example, if x/10 is entered in the Expression field, the Register value will first be divided by 10 and then compared to the value defined in the To field.
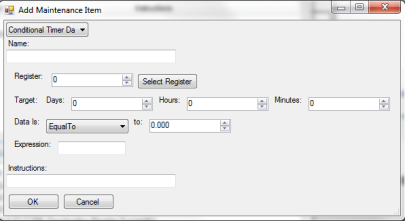
Figure 19 - Conditional Timer Data menu
Conditional Counter: The Conditional Counter counts how many times a bit changes its status. The user assigns the Register, Bit, and Target. Once the Target value is reached, the maintenance item is due. The last field, bit, determines whether the target is counting the bit turning on, the bit turning off, or the bit changing either way.

Figure 20 - Conditional Counter
Total. The Total function (Totalizer) works by checking the assigned Register every minute. Each minute, the current value of the register is added to the total. Once the Target is reached, the item is due for maintenance. The Expression field functions in the same way as the Expression field for the Conditional Timer Data maintenance item.
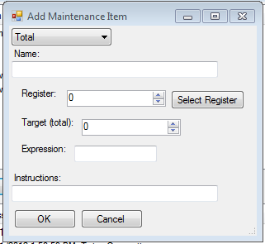
Figure 21 - Total Maintenance Item
To delete a maintenance item, simply highlight it, and press delete.
Maintenance Status
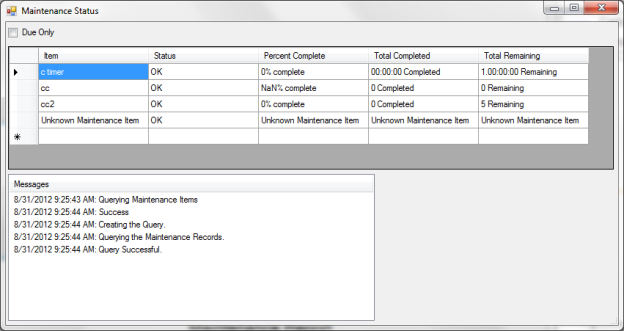
Figure 22 - Maintenance Status screen
The status screen will keep track of the maintenance events. The status column displays whether the defined events are OK (not due) or Due for maintenance. This view also shows the Percent Complete until maintenance is due, the Total Completed, and the Total Remaining until maintenance is due. The option to show only events that are due is available by checking the Due Only box in the top left-hand corner.
Maintenance Report

Figure 23 - Maintenance Report screen
Maintenance Report is the option to view or print out an overview of the maintenance operations. Clicking File à Create Report will bring up a grid overview of the report fields. To change any of the included fields, click Options à Constraints to toggle between displaying fields or not. Options à Sorting will change the way the items are ordered and grouped.
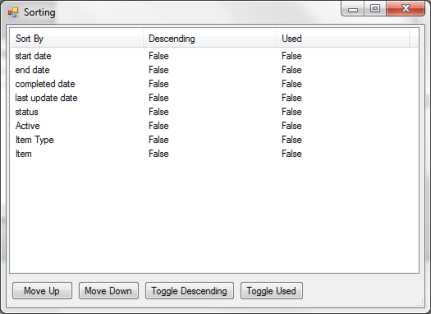
Figure 24 - Sorting window
Toggling between True and False under the Used column will determine which field is used to order the columns. The field at the top of the list is the field that will determine how the maintenance records are ordered first. The higher the field appears on the list, the higher the priority is given to that field in sorting records. The fields can be ordered by ascending date or descending date by toggling the field to True under the Descending column. Options à Columns to change the order of the columns, and Options à Sorting to change the way the items are ordered and grouped. These changes will be shown when File à Create Report is clicked again.
Help
Help contains the options of Check for Updates and About…
Check for Updates: This is an important button to use as it will ensure that TS Manager is running the most recent version. SSi recommends checking for updates each time TS Manager is going to be used.
About… This will provide information about what version of TS Manager is running and what has been changed in the most recent updates.
 The first toolbar item opens a new chart.
 Opens a chart.
 Saves a chart.
 Prints a chart.
 Opens Edit Custom Curves Menu.
 Toggles between showing/hiding notes.
 Toggles between chart view and data grid view.
 Edit trend lines on a chart.
 Drop down list of all controllers available.
 Drop down calendar that enables historical access.
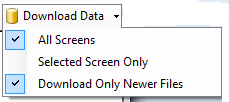
 Downloads data with options of using all screens, selected screen only, and downloading only new files.
 Edit Custom Curves
Most types of inputs that are used in SSi controllers are already setup with a curve built for most every type of thermocouple available, certain vacuum sensors, etc. However, if an application calls for an input without a standard curve, the curve can be built using this option. Voltages can be paired with corresponding values to create a sensor curve based off of a provided equation or data. This allows the controller to make appropriate readings from the sensor.
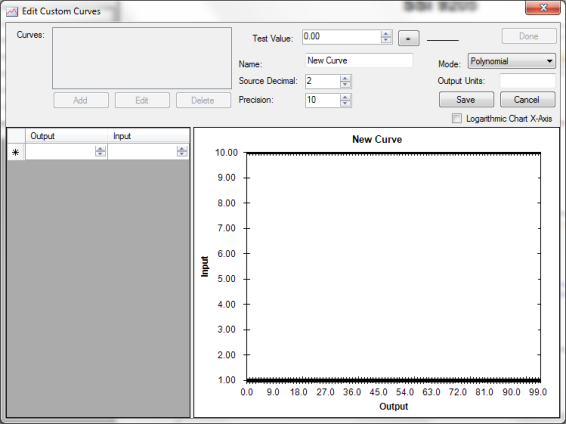
Figure 25 - Edit Custom Curves screen
 Edit Trend Lines
The Edit Trend Lines feature allows you to edit the formatting and ranges of data for charts produced by TS Manager. This feature allows you to adjust the appearance and names of trend lines on the chart as well as the numerical ranges for each trend line displayed in the chart.
To access this feature, first toggle the Edit Chart button  on. The Edit Trend Lines screen will appear. You can then edit the fields shown below.

Figure 26 - Edit Trend Lines screen
-
Name. The name of the trend line that will appear on the chart.
-
Data. The selected data set from which data will be taken to create the trend line.
-
Min. The minimum value displayed in the trend line on the chart.
-
Max. The maximum value displayed in the trend line on the chart.
-
Color (solid color shown). The color of the trend line as it will appear on the chart.
-
Width. The width of the trend line.
-
Format. The number of decimal places shown in the numerical values for that particular trend line.
-
Units. The units shown for that particular trend line (degrees F, percentage, etc.).
-
Expression. A mathematical operation performed on each value displayed on the trend line. x is the original value; the mathematical operation shown indicates the operation performed on x before the newly calculated value is included on the trend line.
-
colTestValue. A test value entered to test the mathematical operation shown in the Expression field.
-
Total. The value resulting from performing the mathematical operation shown in the Expression field on the value shown in colTestValue.
